DevSecOps Project to setup Netflix clone on AWS using CICD, Security, Monitoring and GitOps

🖋️As a professional specializing in Site Reliability Engineering (SRE), DevOps, and Performance Engineering, I thrive on designing and optimizing systems that are both reliable and scalable. My expertise lies in streamlining processes, driving automation, and ensuring high-performance infrastructure that meets modern business demands. I thrive on implementing best practices like observability, capacity planning to enhance system uptime and reliability. I believe in bridging the gap between development and operations by fostering a collaborative culture and aligning teams around shared goals for operational excellence. I am also exploring how predictive models and data-driven insights can enhance system reliability, automate troubleshooting, and optimize performance. Whether it’s building robust infrastructure, optimizing workflows, or leveraging cutting-edge tools, I am dedicated to delivering exceptional results that drive organizational success. Let’s connect to collaborate, share insights, and innovate together in the world of reliable, high-performing systems!🖋️
Phase 1: Initial Setup and Deployment
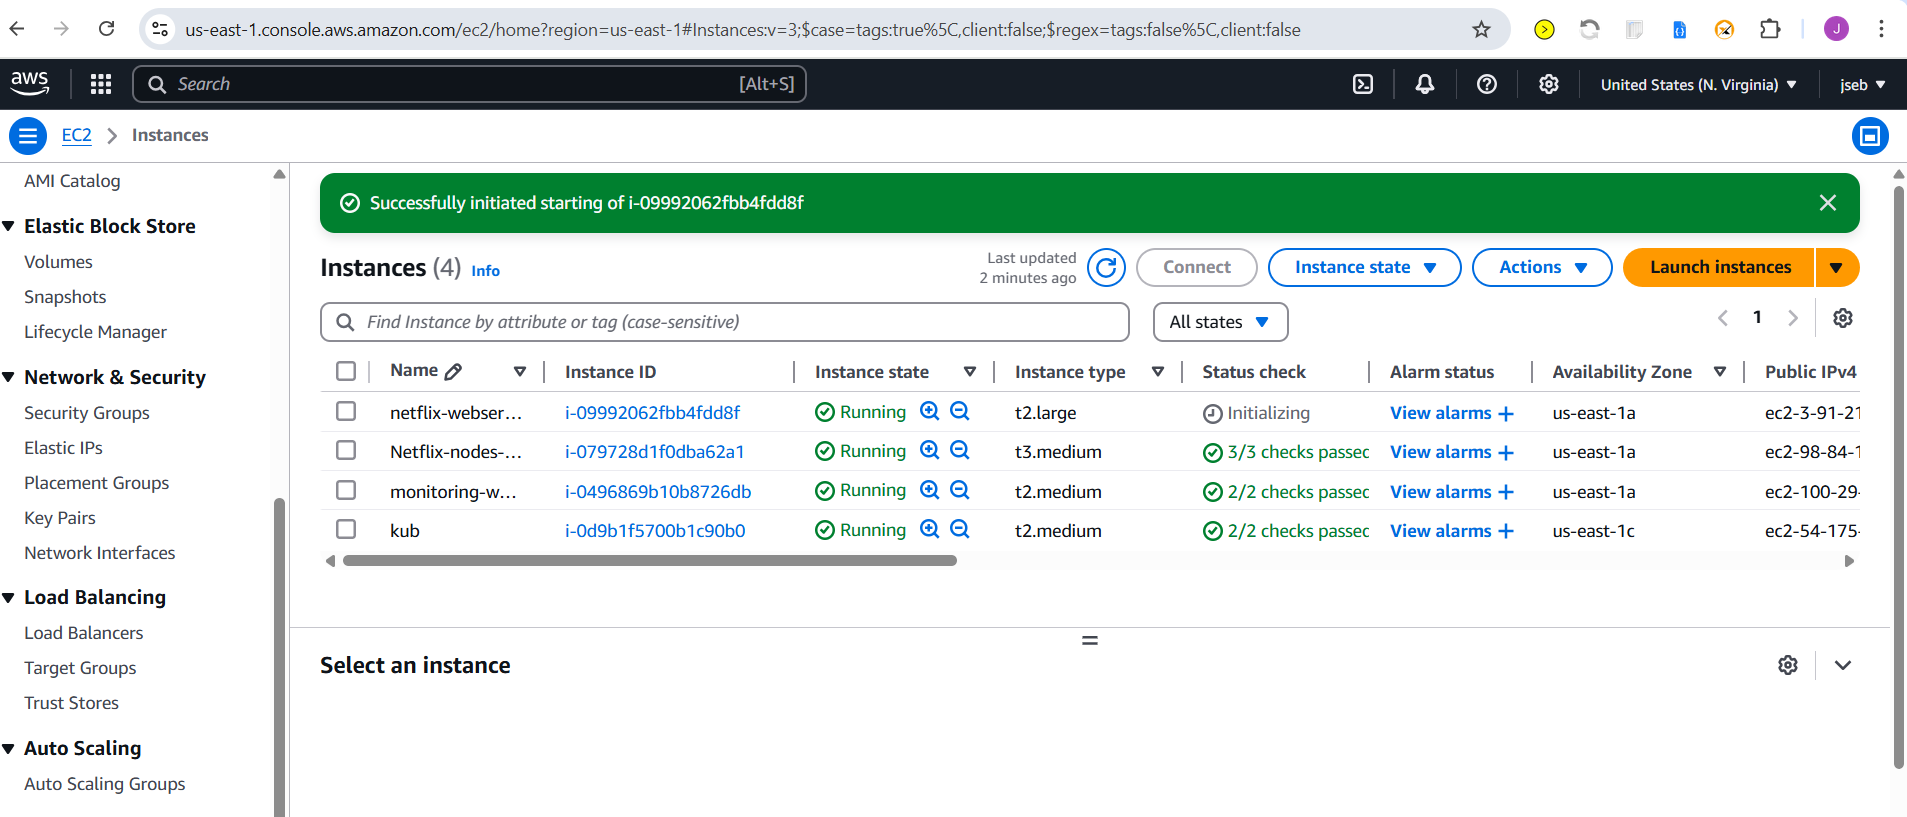
Step 1: Launch EC2 (Ubuntu 22.04)
Provision an EC2 instance on AWS with Ubuntu.
Connect to the instance using SSH.
Here we are using one ec2 instance for setting up jenkins and sonarqube. One for prometheus ,node exporter and grafana setup. Another for argocd,helm(used for prometheus node exporter setup)-which monitors k8 cluster,ekstcl,kubectl setups.
Step 2: Clone the Code:
Update all the packages and then clone the code.
Clone your application's code repository onto the EC2 instance:
git clone https://github.com/jseb37/DevSecOps-Project.git
Step 3: Install Docker and Run the App Using a Container:
Set up Docker on the EC2 instance:
  sudo apt-get update
  sudo apt-get install docker.io -y
  sudo usermod -aG docker $USER  # Replace with your system's username, e.g., 'ubuntu'
  newgrp docker
  sudo chmod 777 /var/run/docker.sock
Build and run your application using Docker containers:
  docker build -t netflix .
  docker run -d --name netflix -p 8081:80 netflix:latest

  #to delete
  docker stop <containerid>
  docker rmi -f netflix
It will show an error cause you need API key
Step 4: Get the API Key:
Open a web browser and navigate to TMDB (The Movie Database) website.
Click on "Login" and create an account.
Once logged in, go to your profile and select "Settings."
Click on "API" from the left-side panel.
Create a new API key by clicking "Create" and accepting the terms and conditions.
Provide the required basic details and click "Submit."
You will receive your TMDB API key.
Now recreate the Docker image with your api key:
docker build --build-arg TMDB_V3_API_KEY=<your-api-key> -t netflix .
Phase 2: Security
Install SonarQube and Trivy:
Install SonarQube and Trivy on the EC2 instance to scan for vulnerabilities.
sonarqube
docker run -d --name sonar -p 9000:9000 sonarqube:lts-communityTo access:
publicIP:9000 (by default username & password is admin)
To install Trivy:
  sudo apt-get install wget apt-transport-https gnupg lsb-release
  wget -qO - https://aquasecurity.github.io/trivy-repo/deb/public.key | sudo apt-key add -
  echo deb https://aquasecurity.github.io/trivy-repo/deb $(lsb_release -sc) main | sudo tee -a /etc/apt/sources.list.d/trivy.list
  sudo apt-get update
  sudo apt-get install trivy
to scan image using trivy
trivy image <imageid>
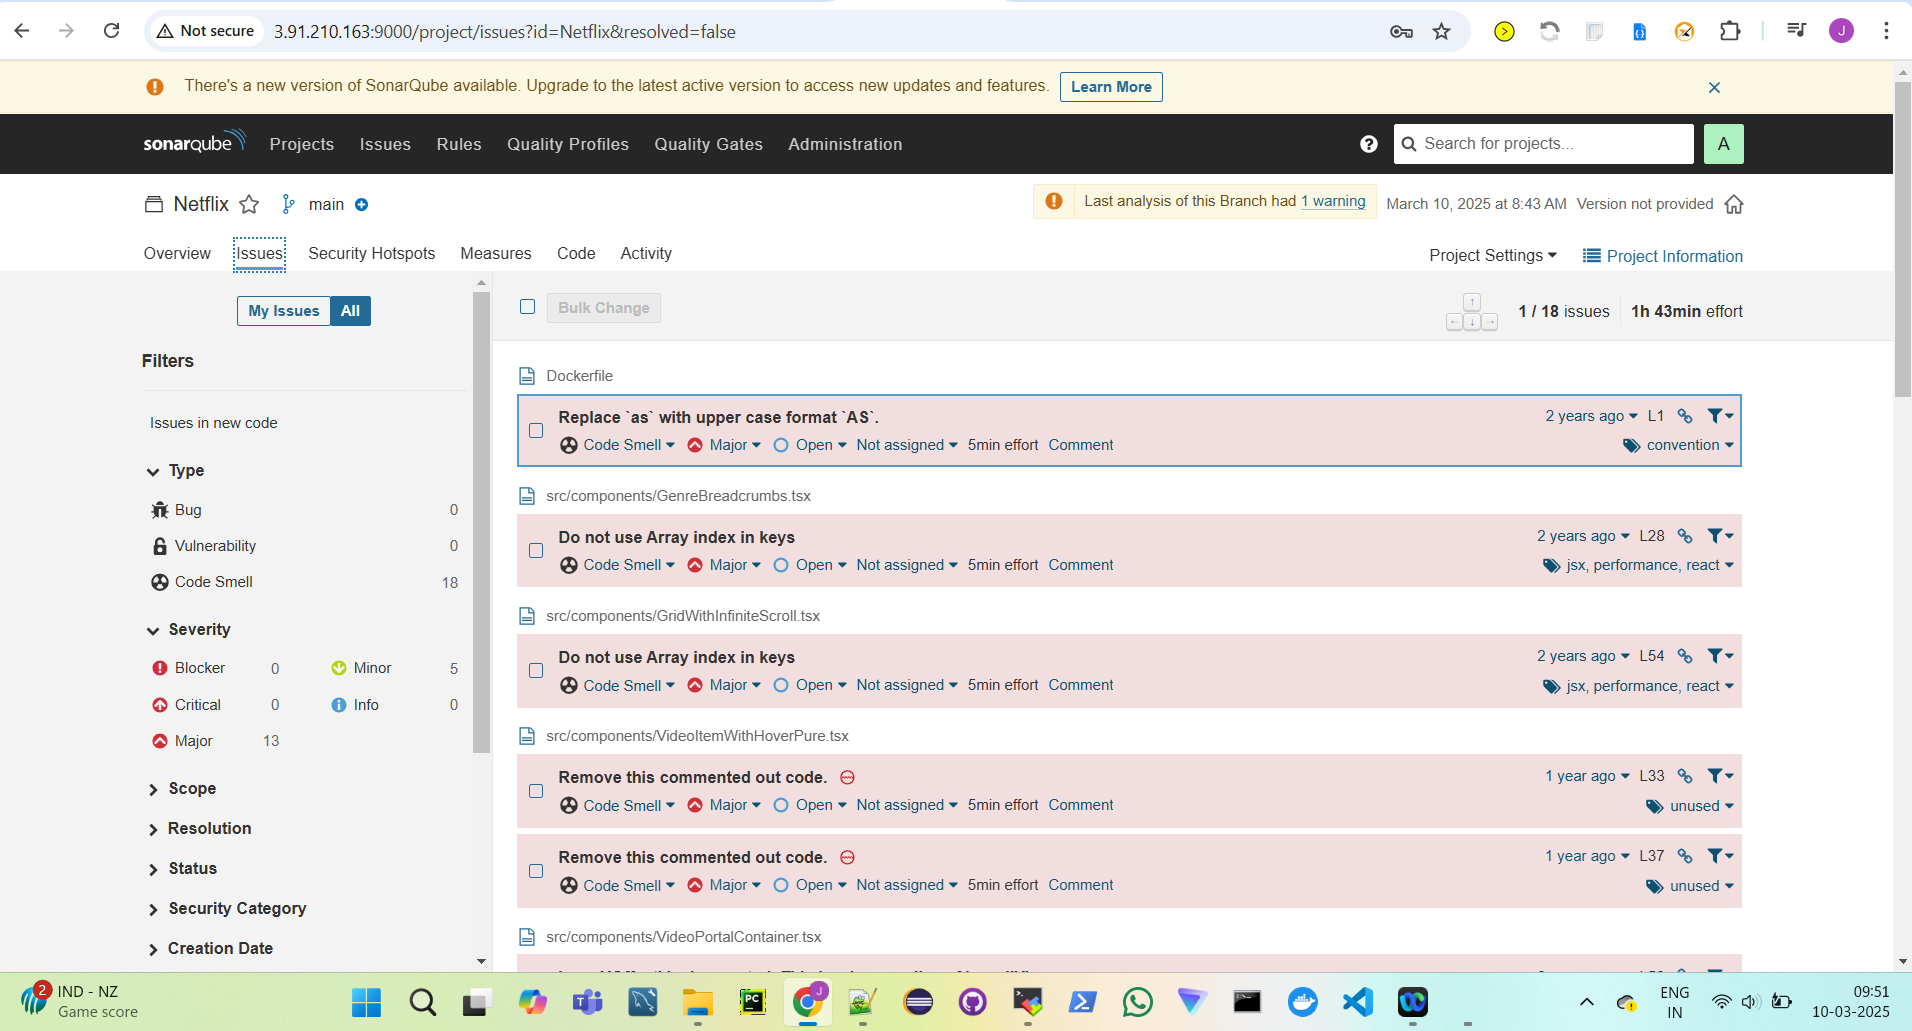
Integrate SonarQube and Configure:
Integrate SonarQube with your CI/CD pipeline.
Configure SonarQube to analyze code for quality and security issues.
Phase 3: CI/CD Setup
Install Jenkins for Automation:
- Install Jenkins on the EC2 instance to automate deployment: Install Java
    sudo apt update
    sudo apt install fontconfig openjdk-17-jre
    java -version
    openjdk version "17.0.8" 2023-07-18
    OpenJDK Runtime Environment (build 17.0.8+7-Debian-1deb12u1)
    OpenJDK 64-Bit Server VM (build 17.0.8+7-Debian-1deb12u1, mixed mode, sharing)

    #jenkins
    sudo wget -O /usr/share/keyrings/jenkins-keyring.asc \
    https://pkg.jenkins.io/debian-stable/jenkins.io-2023.key
    echo deb [signed-by=/usr/share/keyrings/jenkins-keyring.asc] \
    https://pkg.jenkins.io/debian-stable binary/ | sudo tee \
    /etc/apt/sources.list.d/jenkins.list > /dev/null
    sudo apt-get update
    sudo apt-get install jenkins
    sudo systemctl start jenkins
    sudo systemctl enable jenkins
Access Jenkins in a web browser using the public IP of your EC2 instance.
publicIp:8080
- Install Necessary Plugins in Jenkins
Go to Manage Jenkins →Plugins → Available Plugins
Install plugins - Eclipse Temurin Installer ,SonarQube Scanner , NodeJs Plugin, Email Extension Plugin[No Restart required]
- Configure Java and Nodejs in Global Tool Configuration
- Goto Manage Jenkins → Tools → Install JDK(17) and NodeJs(23)→ Click on Apply and Save
4. SonarQube
Create the token in sonarqube after creating project.Token - Administrators → Users -Token],Go to Jenkins Dashboard → Manage Jenkins → Credentials → Add Secret Text.
The Configure System option is used in Jenkins to configure different server ,Global Tool Configuration is used to configure different tools that we install using Plugins
Go to system in jenkins - install sonar qube servers[Add sonar server ip and link the credentials we have provided earlier by passing it in server authentication token
Install sonar scanner from the tools section in jenkins
- Create a Jenkins webhook
- Go to SonarQube → Administration → Webhooks. Check if the webhook URL is correctly configured,The format should be: http://<jenkins-url>/sonarqube-webhook. It’s used to notify jenkins that analysis has been done.
Configure CI/CD Pipeline in Jenkins:
- Create a CI/CD pipeline in Jenkins to automate your application deployment.
pipeline {
    agent any
    tools {
        jdk 'jdk17'
        nodejs 'node23'
    }
    environment {
        SCANNER_HOME = tool 'sonar-scanner'
    }
    stages {
        stage('clean workspace') {
            steps {
                cleanWs()
            }
        }
        stage('Checkout from Git') {
            steps {
                git branch: 'main', url: 'https://github.com/jseb37/DevSecOps-Project.git'
            }
        }
        stage("Sonarqube Analysis") {
            steps {
                withSonarQubeEnv('sonar-server') {
                    sh '''$SCANNER_HOME/bin/sonar-scanner -Dsonar.projectName=Netflix \
                    -Dsonar.projectKey=Netflix'''
                }
            }
        }
        stage("quality gate") {
            steps {
                script {
                    waitForQualityGate abortPipeline: false, credentialsId: 'Sonar-token'
                }
            }
        }
        stage('Install Dependencies') {
            steps {
                sh "npm install"
            }
        }
    }
}
Install and Configure Dependency-Check and Docker Tools in Jenkins
Go to "Dashboard" in your Jenkins web interface.
Navigate to "Manage Jenkins" → "Manage Plugins."
Click on the "Available" tab and search for "OWASP Dependency-Check."
Check the checkbox for "OWASP Dependency-Check" and click on the "Install without restart" button.
After installing the Dependency-Check plugin, you need to configure the tool.
Go to "Dashboard" → "Manage Jenkins" → "Global Tool Configuration."
Find the section for "OWASP Dependency-Check."
Add the tool's name, e.g., "DP-Check."
Save your settings
Go to "Dashboard" in your Jenkins web interface.
Navigate to "Manage Jenkins" → "Manage Plugins."
Click on the "Available" tab and search for "Docker."
Check the Docker-related plugins - Docker,Docker Commons,Docker Pipeline,Docker API,Docker-build-step
Click on the "Install without restart" button to install these plugins.
Add DockerHub Credentials:
To securely handle DockerHub credentials in your Jenkins pipeline, follow these steps:
Go to "Dashboard" → "Manage Jenkins" → "Manage Credentials."
Click on "System" and then "Global credentials (unrestricted)."
Click on "Add Credentials" on the left side.
Choose "Secret text" as the kind of credentials.
Enter your DockerHub credentials (Username and Password) and give the credentials an ID (e.g., "docker").
Click "OK" to save your DockerHub credentials.
Now, you have installed the Dependency-Check plugin, configured the tool, and added Docker-related plugins along with your DockerHub credentials in Jenkins. You can now proceed with configuring your Jenkins pipeline to include these tools and credentials in your CI/CD process.
pipeline {
agent any
tools {
jdk 'jdk17'
nodejs 'node23'
}
environment {
SCANNER_HOME = tool 'sonar-scanner'
}
stages {
stage('Clean Workspace') {
steps {
cleanWs()
}
}
stage('Checkout from Git') {
steps {
git branch: 'main', url: 'https://github.com/jseb37/DevSecOps-Project.git'
}
}
stage("SonarQube Analysis") {
steps {
withSonarQubeEnv('sonar-server') {
sh '''$SCANNER_HOME/bin/sonar-scanner -Dsonar.projectName=Netflix \
-Dsonar.projectKey=Netflix'''
}
}
}
stage("Quality Gate") {
steps {
script {
waitForQualityGate abortPipeline: false, credentialsId: 'Sonar-token'
}
}
}
stage('Install Dependencies') {
steps {
sh "npm install"
}
}
stage('OWASP FS Scan') {
environment {
NVD_API_KEY = credentials('nvd-api-key-id') //OWASP Dependency Check fetches vulnerability data from the NIST National Vulnerability Database(NVD).NVD limits requests without an API key, leading to slow scans or failures.To improve scan speed, you need an API key from NVD's API Program.
}
steps {
script {
dependencyCheck additionalArguments: "--scan ./ --disableYarnAudit --disableNodeAudit --nvdApiKey $NVD_API_KEY", odcInstallation: 'DP-Check'
dependencyCheckPublisher pattern: '**/dependency-check-report.xml'
}
}
}
stage('Trivy FS Scan') {
steps {
sh "trivy fs . > trivyfs.txt"
}
}
stage("Docker Build & Push") {
steps {
script {
withDockerRegistry(credentialsId: 'docker', toolName: 'docker') {
sh "docker build --build-arg TMDB_V3_API_KEY=\$TMDB_KEY -t netflix ."
sh "docker tag netflix <dockerusername>/<image>:<tag>"
sh "docker push <dockerusername>/<image>:<tag>"
}
}
}
}
stage("Trivy Image Scan") {
steps {
sh "trivy image <dockerusername>/<image>:<tag> > trivyimage.txt"
}
}
stage('Deploy to Container') {
steps {
sh 'docker run -d --name netflix-$(date +%s) -p 8081:80 <dockerusername>/<image>:<tag>'
}
}
}
post {
always {
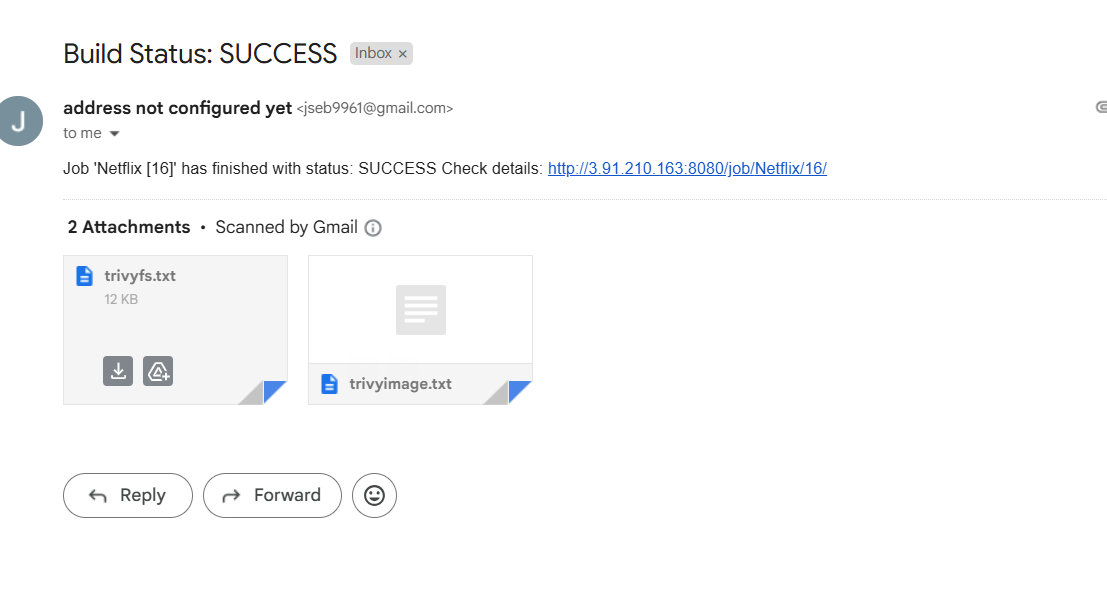
emailext (
subject: "Build Status: ${currentBuild.currentResult}",
body: "Job '${env.JOB_NAME} [${env.BUILD_NUMBER}]' has finished with status: ${currentBuild.currentResult}\nCheck details: ${env.BUILD_URL}",
to: '<EmailId>',
attachmentsPattern: 'trivyfs.txt,trivyimage.txt'
)
}
}
}
Jenkins Run
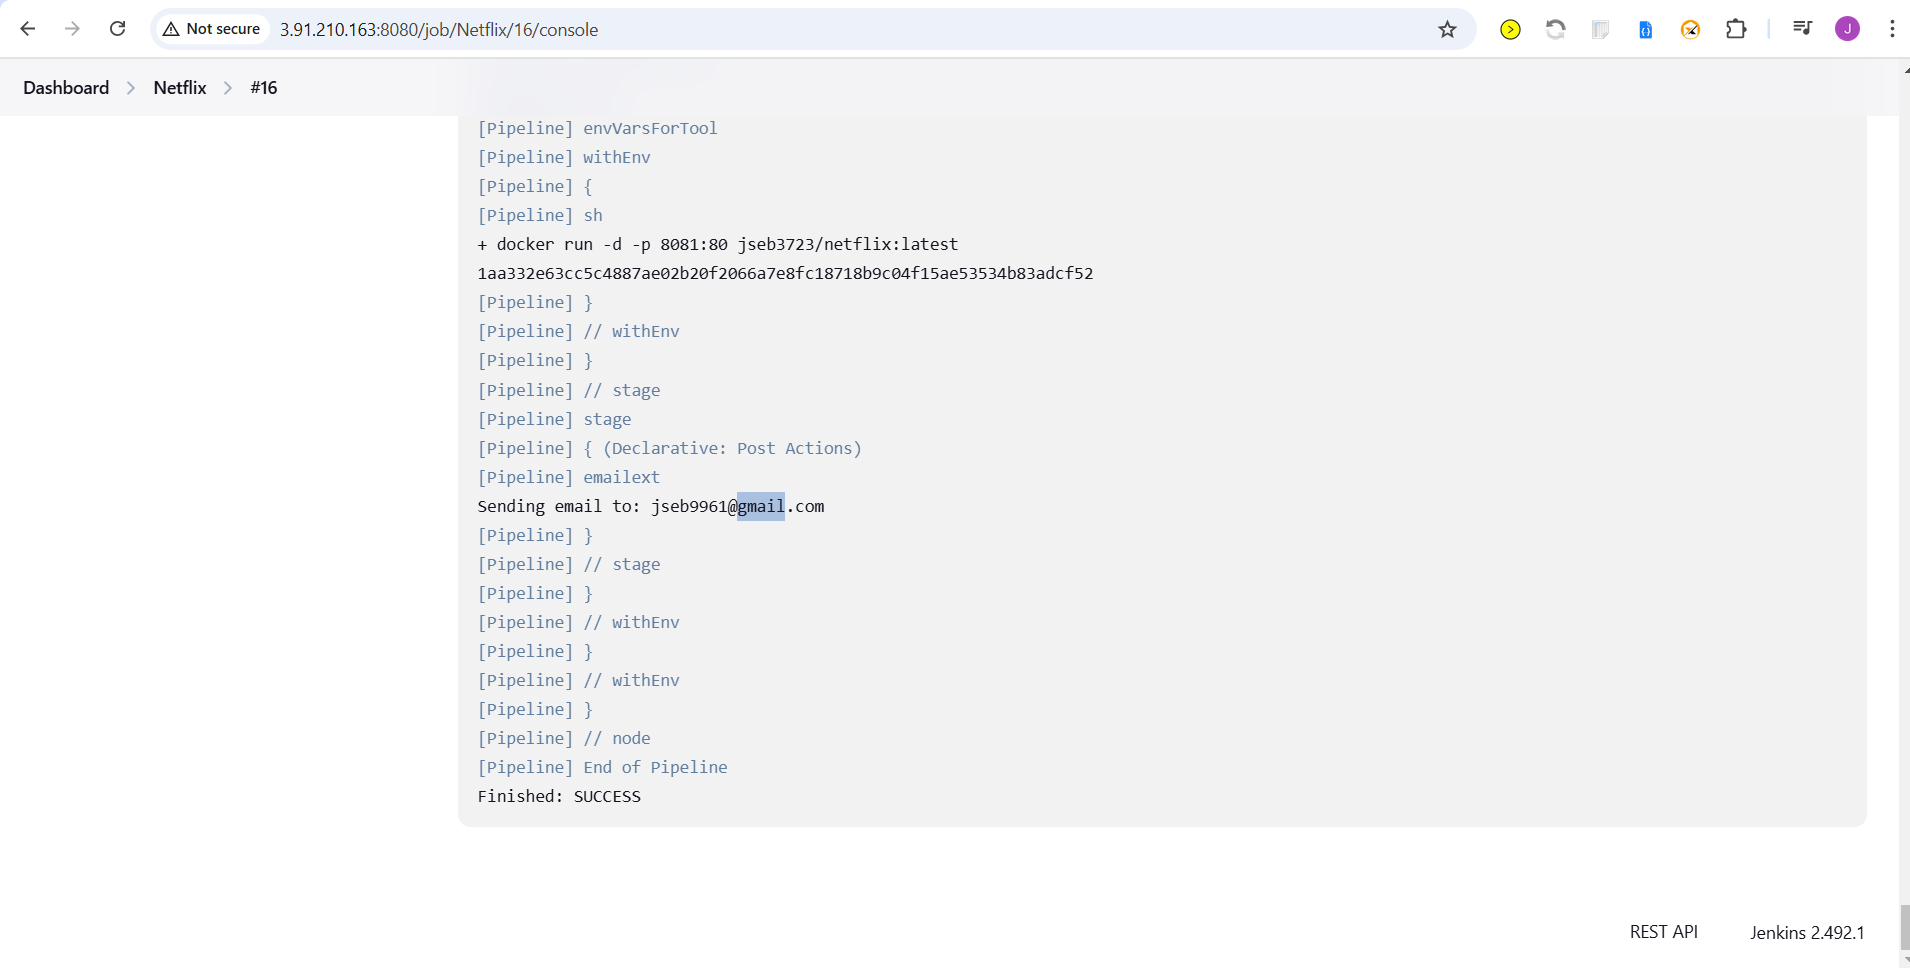
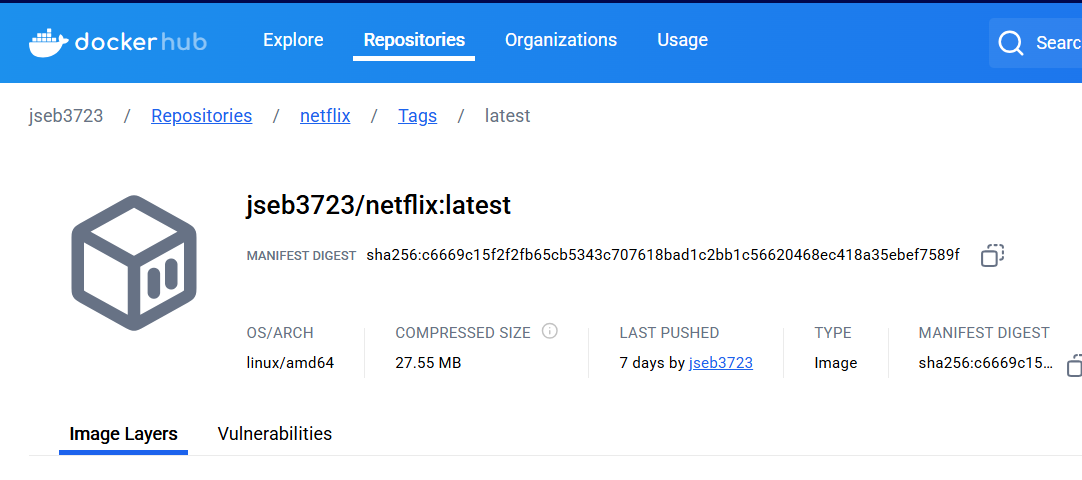
Image Pushed To DockerHub After CI Run
Mail Received After Jenkins Run With Trivy Scan Result Attached
Phase 4: Monitoring
Install Prometheus and Grafana:
Set up Prometheus and Grafana to monitor your application.
Installing Prometheus:
First, create a dedicated Linux user for Prometheus and download Prometheus:
 sudo useradd --system --no-create-home --shell /bin/false prometheus
 wget https://github.com/prometheus/prometheus/releases/download/v2.47.1/prometheus-2.47.1.linux-amd64.tar.gz
Extract Prometheus files, move them, and create directories:
 tar -xvf prometheus-2.47.1.linux-amd64.tar.gz
 cd prometheus-2.47.1.linux-amd64/
 sudo mkdir -p /data /etc/prometheus
 sudo mv prometheus promtool /usr/local/bin/
 sudo mv consoles/ console_libraries/ /etc/prometheus/
 sudo mv prometheus.yml /etc/prometheus/prometheus.yml
Set ownership for directories:
sudo chown -R prometheus:prometheus /etc/prometheus/ /data/Create a systemd unit configuration file for Prometheus:
sudo nano /etc/systemd/system/prometheus.serviceAdd the following content to the
prometheus.servicefile:[Unit] Description=Prometheus Wants=network-online.target After=network-online.target StartLimitIntervalSec=500 StartLimitBurst=5 [Service] User=prometheus Group=prometheus Type=simple Restart=on-failure RestartSec=5s ExecStart=/usr/local/bin/prometheus \ --config.file=/etc/prometheus/prometheus.yml \ --storage.tsdb.path=/data \ --web.console.templates=/etc/prometheus/consoles \ --web.console.libraries=/etc/prometheus/console_libraries \ --web.listen-address=0.0.0.0:9090 \ --web.enable-lifecycle [Install] WantedBy=multi-user.targetHere's a brief explanation of the key parts in this
prometheus.servicefile:UserandGroupspecify the Linux user and group under which Prometheus will run.ExecStartis where you specify the Prometheus binary path, the location of the configuration file (prometheus.yml), the storage directory, and other settings.web.listen-addressconfigures Prometheus to listen on all network interfaces on port 9090.web.enable-lifecycleallows for management of Prometheus through API calls.
Enable and start Prometheus:
    sudo systemctl enable prometheus
    sudo systemctl start prometheus
Verify Prometheus's status:
sudo systemctl status prometheus
You can access Prometheus in a web browser using your server's IP and port 9090:
http://<your-server-ip>:9090
Installing Node Exporter:
Create a system user for Node Exporter and download Node Exporter:
    sudo useradd --system --no-create-home --shell /bin/false node_exporter
    wget https://github.com/prometheus/node_exporter/releases/download/v1.6.1/node_exporter-1.6.1.linux-amd64.tar.gz
Extract Node Exporter files, move the binary, and clean up:
    tar -xvf node_exporter-1.6.1.linux-amd64.tar.gz
    sudo mv node_exporter-1.6.1.linux-amd64/node_exporter /usr/local/bin/
    rm -rf node_exporter*
Create a systemd unit configuration file for Node Exporter:
sudo nano /etc/systemd/system/node_exporter.service
Add the following content to the node_exporter.service file:
    [Unit]
    Description=Node Exporter
    Wants=network-online.target
    After=network-online.target

    StartLimitIntervalSec=500
    StartLimitBurst=5

    [Service]
    User=node_exporter
    Group=node_exporter
    Type=simple
    Restart=on-failure
    RestartSec=5s
    ExecStart=/usr/local/bin/node_exporter --collector.logind

    [Install]
    WantedBy=multi-user.target
Replace --collector.logind with any additional flags as needed.
Enable and start Node Exporter:
    sudo systemctl enable node_exporter
    sudo systemctl start node_exporter
Verify the Node Exporter's status:
sudo systemctl status node_exporter
You can access Node Exporter metrics in Prometheus.
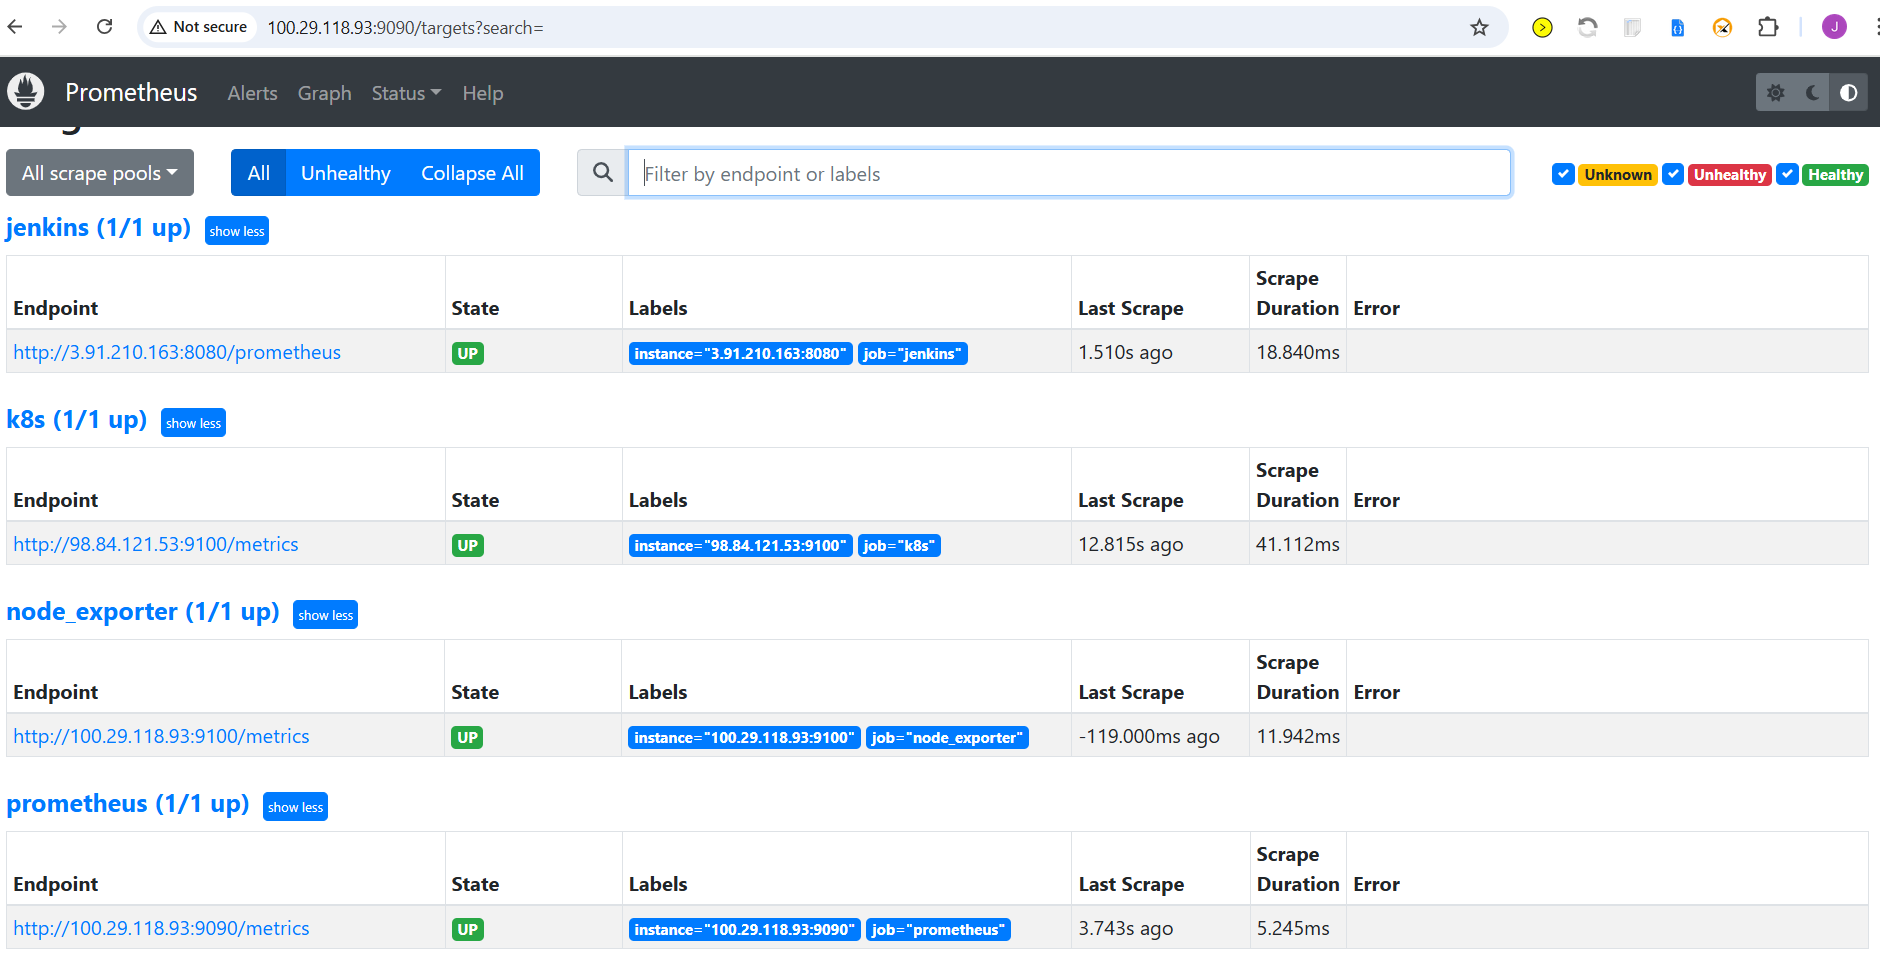
Configure Prometheus Plugin Integration:
Integrate Jenkins with Prometheus to monitor the CI/CD pipeline.
Prometheus Configuration:
To configure Prometheus to scrape metrics from Node Exporter and Jenkins, you need to modify the
prometheus.ymlfile. Here is an exampleprometheus.ymlconfiguration for your setup:global: scrape_interval: 15s scrape_configs: - job_name: 'node_exporter' static_configs: - targets: ['localhost:9100'] - job_name: 'jenkins' metrics_path: '/prometheus' static_configs: - targets: ['<your-jenkins-ip>:<your-jenkins-port>']Make sure to replace
<your-jenkins-ip>and<your-jenkins-port>with the appropriate values for your Jenkins setup.Check the validity of the configuration file:
promtool check config /etc/prometheus/prometheus.ymlReload the Prometheus configuration without restarting:
curl -X POST http://localhost:9090/-/reloadYou can access Prometheus targets at:
http://<your-prometheus-ip>:9090/targets
Install Grafana on Ubuntu 22.04 and Set it up to Work with Prometheus
Step 1: Install Dependencies:
First, ensure that all necessary dependencies are installed:
sudo apt-get update
sudo apt-get install -y apt-transport-https software-properties-common
Step 2: Add the GPG Key:
Add the GPG key for Grafana:
wget -q -O - https://packages.grafana.com/gpg.key | sudo apt-key add -
Step 3: Add Grafana Repository:
Add the repository for Grafana stable releases:
echo "deb https://packages.grafana.com/oss/deb stable main" | sudo tee -a /etc/apt/sources.list.d/grafana.list
Step 4: Update and Install Grafana:
Update the package list and install Grafana:
sudo apt-get update
sudo apt-get -y install grafana
Step 5: Enable and Start Grafana Service:
To automatically start Grafana after a reboot, enable the service:
sudo systemctl enable grafana-server
Then, start Grafana:
sudo systemctl start grafana-server
Step 6: Check Grafana Status:
Verify the status of the Grafana service to ensure it's running correctly:
sudo systemctl status grafana-server
Step 7: Access Grafana Web Interface:
Open a web browser and navigate to Grafana using your server's IP address. The default port for Grafana is 3000. For example:
http://<your-server-ip>:3000
You'll be prompted to log in to Grafana. The default username is "admin," and the default password is also "admin."
Step 8: Change the Default Password:
When you log in for the first time, Grafana will prompt you to change the default password for security reasons. Follow the prompts to set a new password.
Step 9: Add Prometheus Data Source:
To visualize metrics, you need to add a data source. Follow these steps:
Click on the "Add data source" button.
Choose "Prometheus" as the data source type.
In the "HTTP" section:
Set the "URL" to
http://localhost:9090(assuming Prometheus is running on the same server).Click the "Save & Test" button to ensure the data source is working.
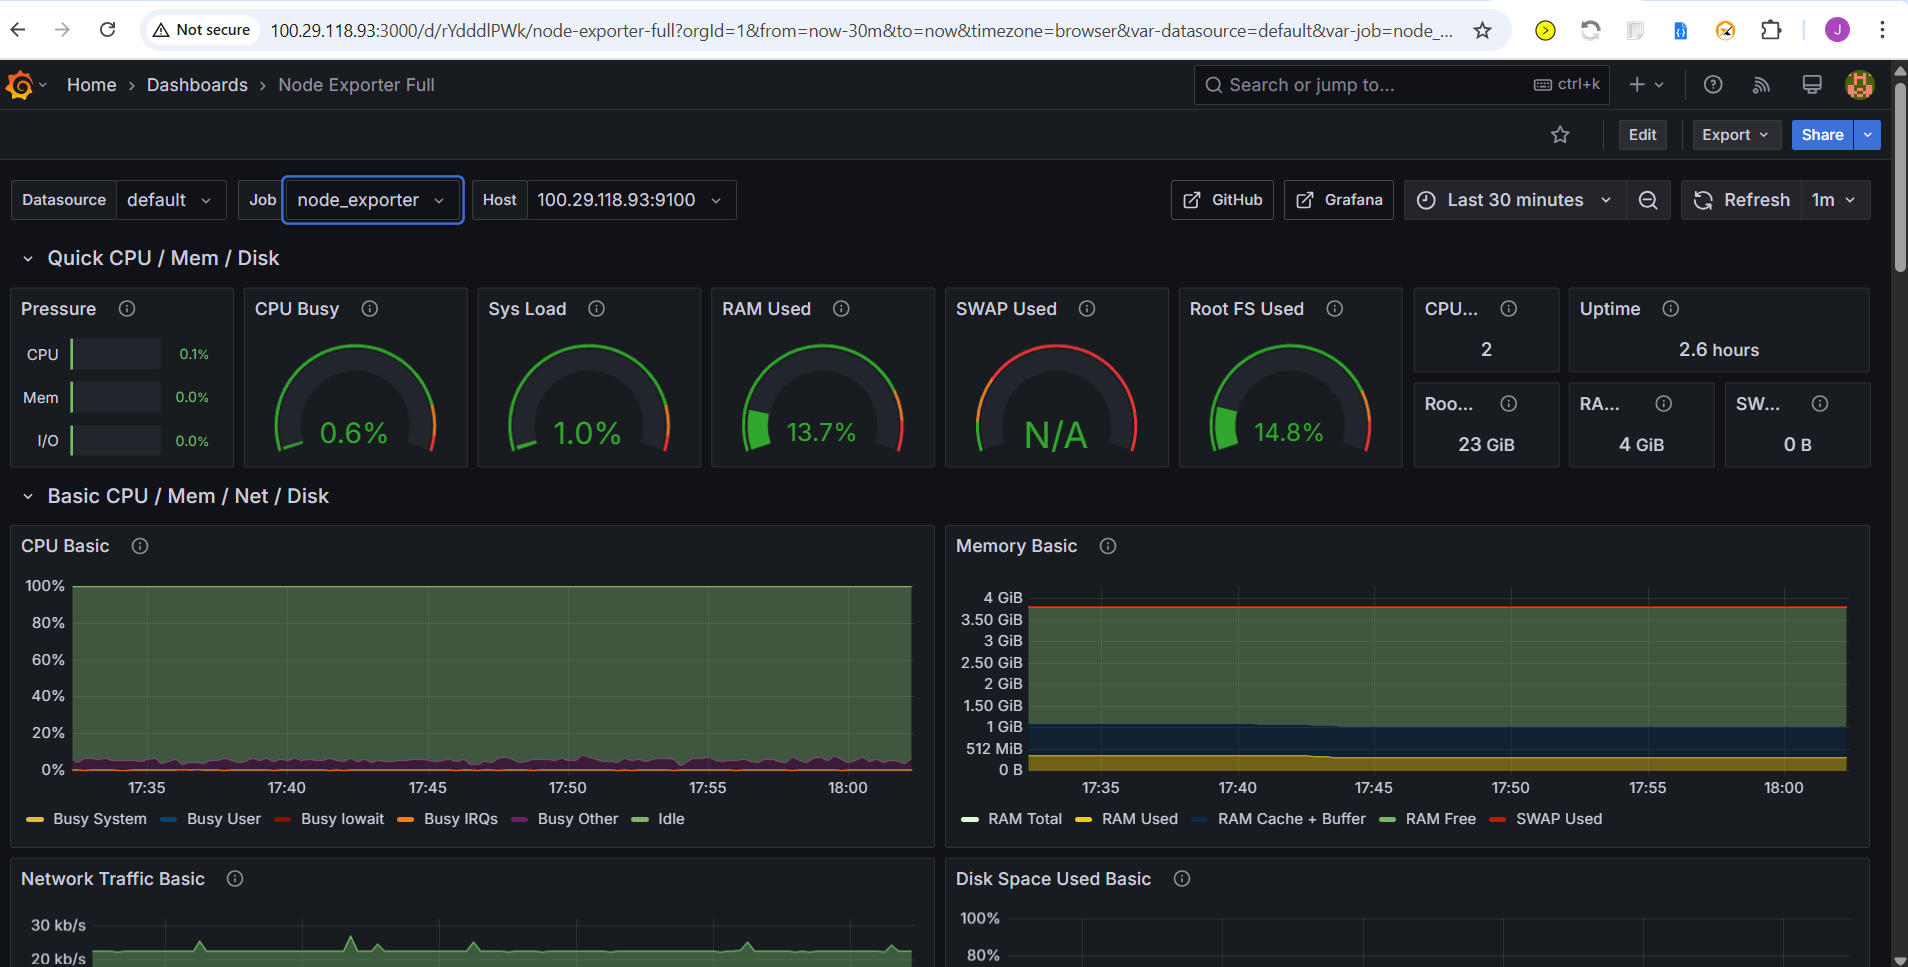
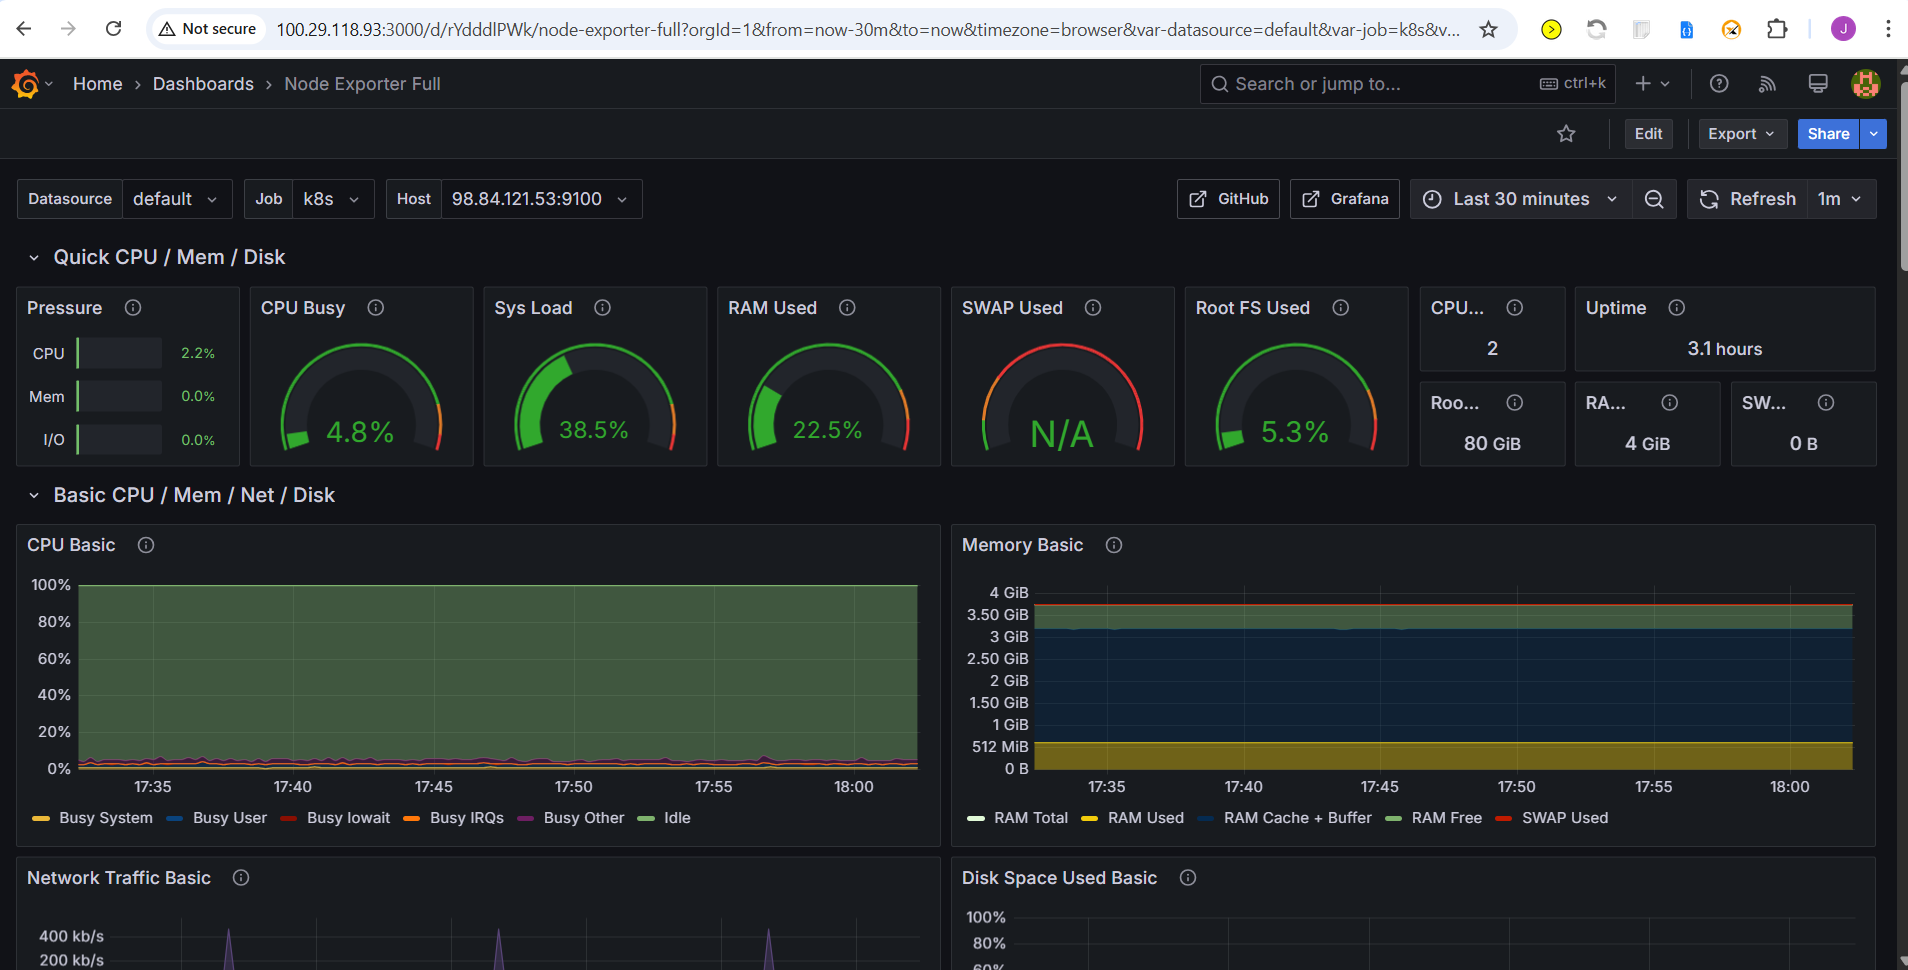
Step 10: Import a Dashboard:
To make it easier to view metrics, you can import a pre-configured dashboard. Follow these steps:
Home→Dashboard
Click on the "Import" dashboard option.
Enter the dashboard code you want to import (e.g., code 1860).
Click the "Load" button.
Select the data source you added (Prometheus) from the dropdown.
Click on the "Import" button.
You should now have a Grafana dashboard set up to visualize metrics from Prometheus.
Grafana is a powerful tool for creating visualizations and dashboards, and you can further customize it to suit your specific monitoring needs.
That's it! You've successfully installed and set up Grafana to work with Prometheus for monitoring and visualization.
Configure Prometheus Plugin Integration:
- Integrate Jenkins with Prometheus to monitor the CI/CD pipeline.
Phase 5: Notification
Implement Notification Services:
- Set up email notifications in Jenkins or other notification mechanisms.
Phase 6: Kubernetes
Create Kubernetes Cluster with Nodegroups
In this phase, you'll set up a Kubernetes cluster with node groups. This will provide a scalable environment to deploy and manage your applications.
Prerequisites
AWS CLI Install
curl "https://awscli.amazonaws.com/awscli-exe-linux-x86_64.zip" -o "awscliv2.zip"
sudo apt install unzip
unzip awscliv2.zip
sudo ./aws/install
Install EKSCTL
# for ARM systems, set ARCH to: `arm64`, `armv6` or `armv7`
ARCH=amd64
PLATFORM=$(uname -s)_$ARCH

curl -sLO "https://github.com/eksctl-io/eksctl/releases/latest/download/eksctl_$PLATFORM.tar.gz"

# (Optional) Verify checksum
curl -sL "https://github.com/eksctl-io/eksctl/releases/latest/download/eksctl_checksums.txt" | grep $PLATFORM | sha256sum --check

tar -xzf eksctl_$PLATFORM.tar.gz -C /tmp && rm eksctl_$PLATFORM.tar.gz

sudo mv /tmp/eksctl /usr/local/bin
Install Kubectl
curl -LO "https://dl.k8s.io/release/$(curl -L -s https://dl.k8s.io/release/stable.txt)/bin/linux/amd64/kubectl"
curl -LO "https://dl.k8s.io/release/$(curl -L -s https://dl.k8s.io/release/stable.txt)/bin/linux/amd64/kubectl.sha256"
cho "$(cat kubectl.sha256)  kubectl" | sha256sum --check
sudo install -o root -g root -m 0755 kubectl /usr/local/bin/kubectl
kubectl version --client
Install Helm
curl https://raw.githubusercontent.com/helm/helm/main/scripts/get-helm-3 | bash
AWS CLI configure by providing access keys
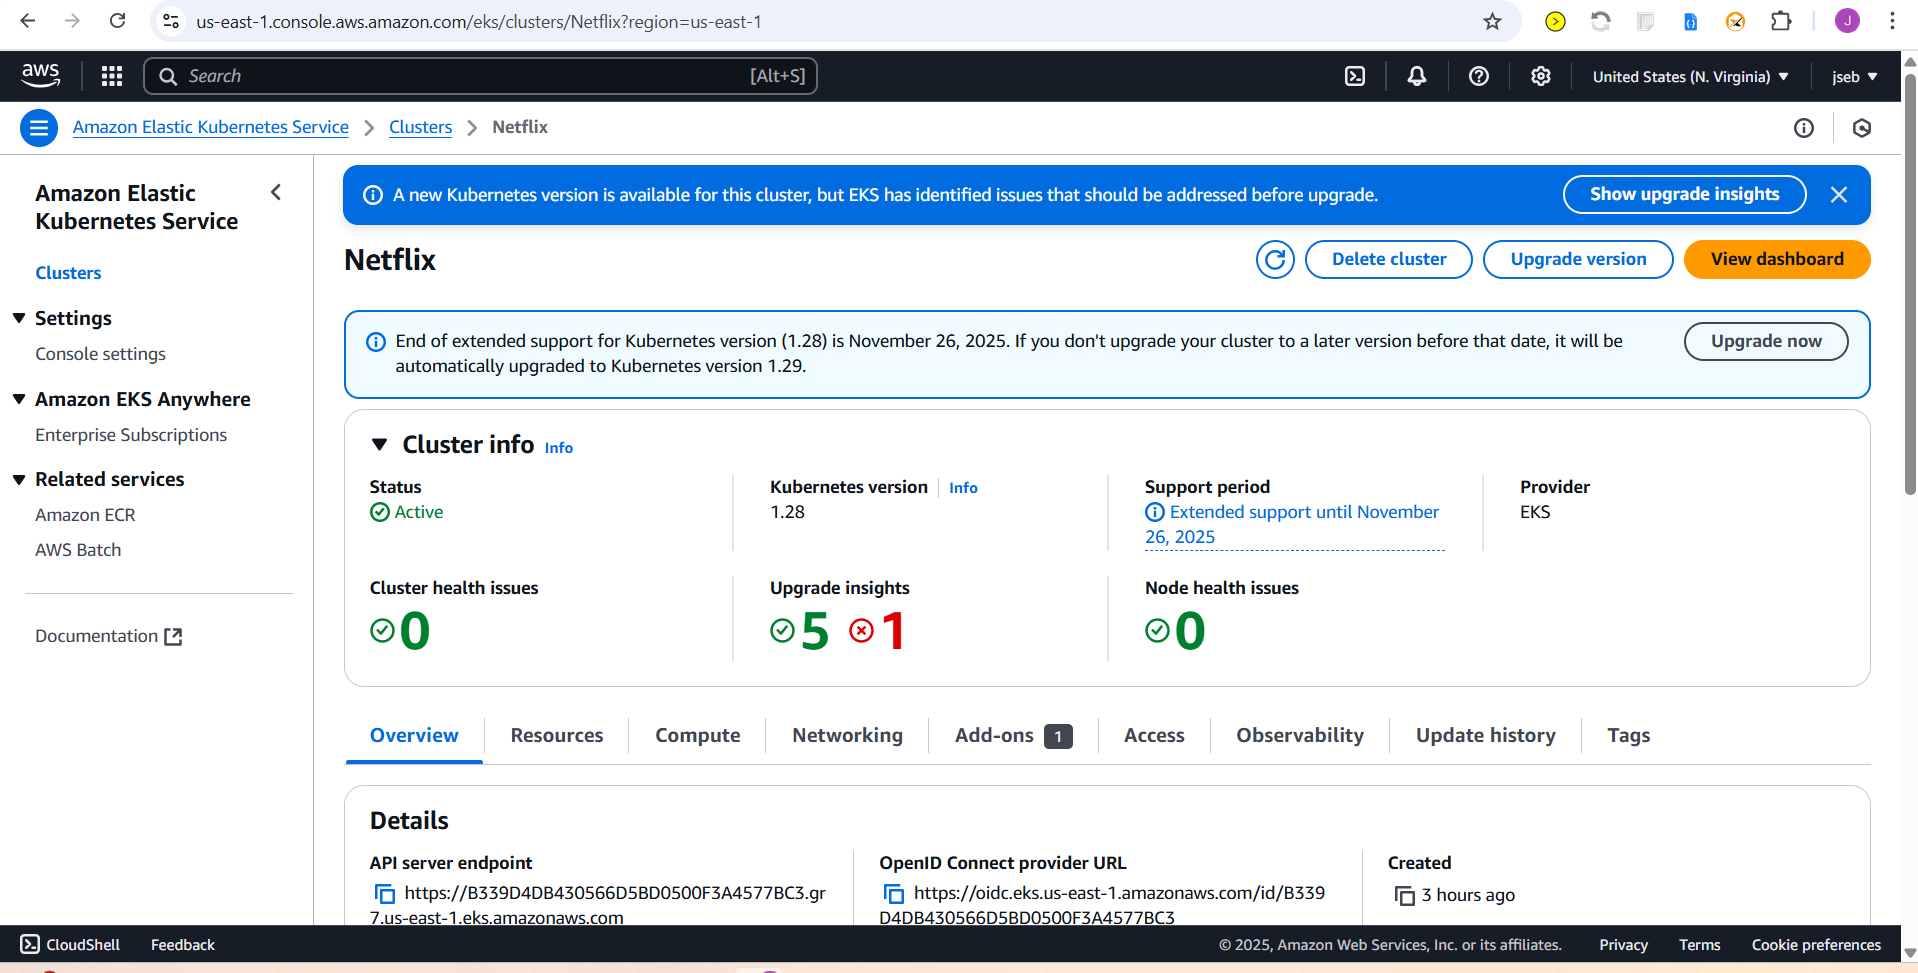
Create Kubernetes Cluster With NodeGroup Using EKSCTL
eksctl create cluster \
  --name Netflix \
  --region us-east-1 \
  --version 1.31 \
  --nodegroup-name n \
  --node-type t3.medium \
  --nodes 1 \
  --nodes-min 1 \
  --nodes-max 1 \
  --managed
Update KubeConfig
When setting up access to a new Amazon EKS cluster, you need to generate or update your kubeconfig file to interact with the cluster
aws eks update-kubeconfig --name Netflix --region us-east-1
Monitor Kubernetes with Prometheus
Prometheus is a powerful monitoring and alerting toolkit, and you'll use it to monitor your Kubernetes cluster. Additionally, you'll install the node exporter using Helm to collect metrics from your cluster nodes.
Install Node Exporter using Helm
To begin monitoring your Kubernetes cluster, you'll install the Prometheus Node Exporter. This component allows you to collect system-level metrics from your cluster nodes. Here are the steps to install the Node Exporter using Helm:
Add the Prometheus Community Helm repository:
helm repo add prometheus-community https://prometheus-community.github.io/helm-chartsCreate a Kubernetes namespace for the Node Exporter:
kubectl create namespace prometheus-node-exporterInstall the Node Exporter using Helm:
helm install prometheus-node-exporter prometheus-community/prometheus-node-exporter --namespace prometheus-node-exporter
Add a Job to Scrape Metrics on nodeip:9100/metrics in prometheus.yml:
Update your Prometheus configuration (prometheus.yml) to add a new job for scraping metrics from nodeip:9100/metrics. You can do this by adding the following configuration to your prometheus.yml file:
  - job_name: 'Netflix'
    metrics_path: '/metrics'
    static_configs:
      - targets: ['<node1Ip>:9100']
Replace 'your-job-name' with a descriptive name for your job. The static_configs section specifies the targets to scrape metrics from, and in this case, it's set to nodeip:9100.
Make sure the ports provided above is added in security group of the node
Don't forget to reload or restart Prometheus to apply these changes to your configuration.
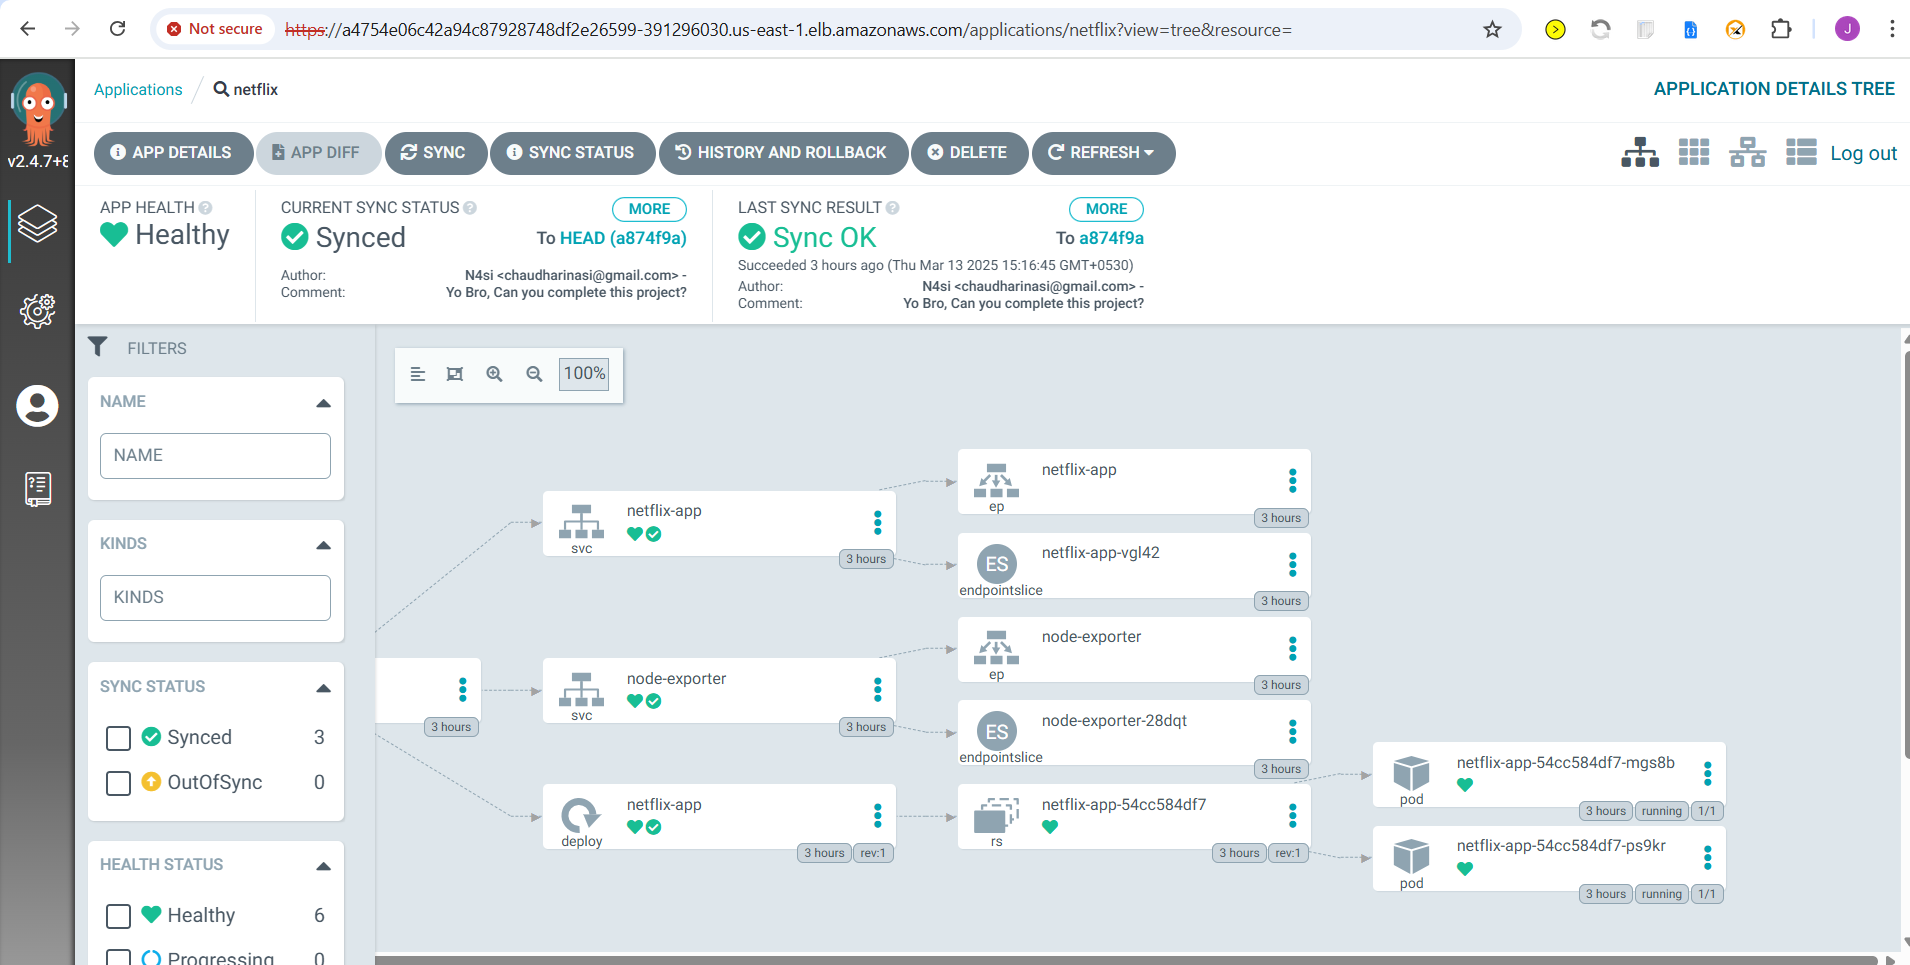
To deploy an application with ArgoCD, you can follow these steps, which I'll outline in Markdown format:
Deploy Application with ArgoCD
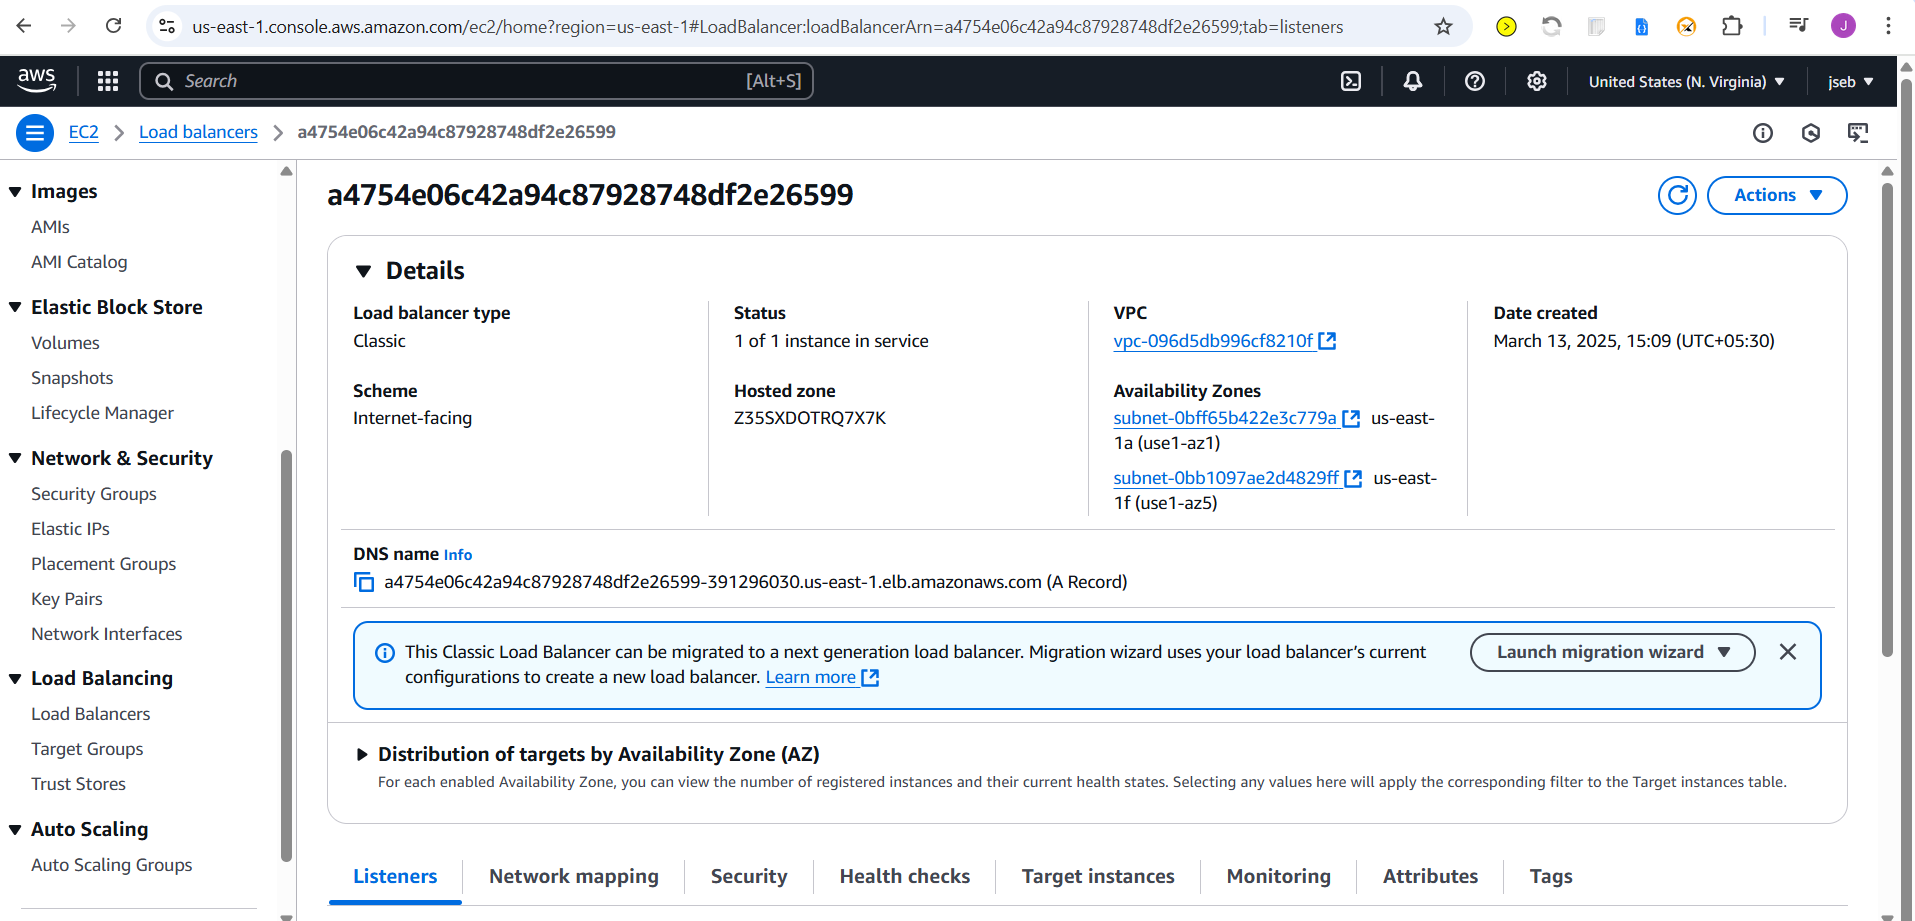
Install ArgoCD:
```plaintext kubectl create namespace argocd kubectl apply -n argocd -f https://raw.githubusercontent.com/argoproj/argo-cd/stable/manifests/install.yaml
kubectl get ns
kubectl get all -n argocd
kubectl patch svc argocd-server -n argocd -p '{"spec": {"type": "LoadBalancer"}}'
kubectl get svc argocd-server -n argocd -w
we can see external ip from above command output eg :- access a090fdfd0683948csdsd55f2ae2f50-1282337088.us-west-1.elb.amazonaws.com
Get the password using below command to access argocd UI username default is admin
kubectl -n argocd get secret argocd-initial-admin-secret -o jsonpath="{.data.password}" | base64 -d
```
Set Your GitHub Repository as a Source:
After installing ArgoCD, you need to set up your GitHub repository as a source for your application deployment. This typically involves configuring the connection to your repository and defining the source for your ArgoCD application. The specific steps will depend on your setup and requirements.
Create an ArgoCD Application:
name: Set the name for your application.destination: Define the destination where your application should be deployed.project: Specify the project the application belongs to.source: Set the source of your application, including the GitHub repository URL, revision, and the path to the application within the repository.syncPolicy: Configure the sync policy, including automatic syncing, pruning, and self-healing.
Access your Application
- To Access the app make sure port 30007 is open in your security group and then open a new tab paste your <k8NodeIP>:30007, your app should be running. Node port 30007 is defined in k8 manifest file
Phase 7: Cleanup
Cleanup AWS EC2 Instances:
eksctl delete cluster --name Netflix --region us-east-1Terminate AWS EC2 instances that are no longer needed.